Building a Custom Patching Dashboard for Technicians in Bright Gauge.
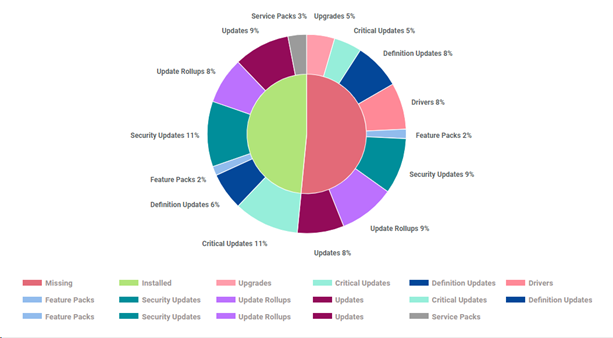
Overall Patching
Dataset: OS Patch Assessment – Windows (This dataset contains detailed results of the OS Patch Assessment which we run on endpoints. It contains crucial information like the patch release date, KB ID, Latest patch status, patch title, NOC recommendation, etc. Data is collected at the end of each day and reported daily)
Type: Pie
Measure: id – Client Name.
Dimensions: Patch Status
Filters: Patch Status – Missing, Installed, Pending Reboot
Design: Color thresholds Patch Status (Missing: Red; Installed: Green; Pending Reboot: Yellow, Label
Drilldown: Client Name: Friendly Name, Endpoint Type, Patch Status, Severity, Latest Patch Title, Last assessed, Installed Date, NOC Recommendations, Latest Reboot Behaviour Name.
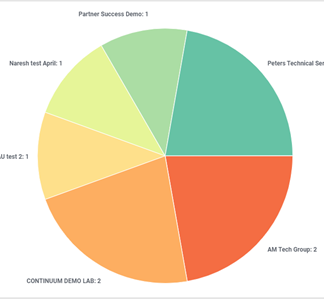
Sites less than 50% Compliance
Dataset: OS Patch Compliance (This dataset contains summarized details about the compliance score of each endpoint. Compliance displays a scoring percentage based from patches installed or missing per the policy. This dataset contains additional details like compliance percentage, compliance percentage by policy, last assessed date OS name, etc. Data is available for the last 4 months at a daily level. Data is collected every 24 hours from the source but only the latest data for each day is considered and synchronized into the Bright Gauge dataset.)
Type: Pie
Measure: id –Friendly Name.
Dimensions: Site Name
Filters: Policy Compliance Percentage (less Than (n of days), Report Date (yesterday)
Design: Color thresholds Policy Compliance Percentage, Label
Drilldown: Site Name: Friendly Name, Policy Compliance Percentage, Last assessed,
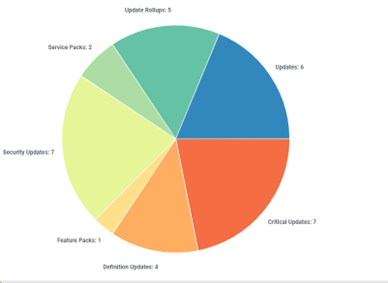
Missing Patches By Classification
Dataset: OS Patch Assessment – Windows
Type: Pie
Measure: id – Client Name.
Dimensions: Classification
Filters: Patch Status – Missing,
Design: Color thresholds Classification, Label
Drilldown: Client Name: Friendly Name, Endpoint Type, Patch Status, Severity, Latest Patch Title, Last assessed, Installed Date, NOC Recommendations, Latest Reboot Behaviour Name.
Installed Patches By Classification
Dataset: OS Patch Assessment – Windows
Type: Pie
Measure: id – Client Name.
Dimensions: Classification
Filters: Patch Status – Installed
Design: Color thresholds Classification, Label
Drilldown: Client Name: Friendly Name, Endpoint Type, Patch Status, Severity, Latest Patch Title, Last assessed, Installed Date, NOC Recommendations, Latest Reboot Behaviour Name.